 Sachin Gupta
 5paisa Research Team
by
Sachin Gupta
15th Jul 2024
Weekly Outlook on Natural Gas - 07 June 2024

Last Updated: 10th June 2024 - 03:20 pm
Natural gas prices surged by 2.54%, closing at 234, driven by a confluence of factors including a recent decline in daily output and forecasts predicting hotter-than-normal weather for the latter half of June. These conditions are boosting demand expectations, particularly with rising gas flow to liquefied natural gas (LNG) export facilities, as the Freeport LNG plant in Texas resumes operations. Despite this uptick, exports remain below the peak levels recorded in December 2023 due to ongoing maintenance at several facilities.
Gas production in the Lower 48 US states has averaged 98.0 billion cubic feet per day (bcfd) in June, slightly down from May's 98.1 bcfd and significantly below the record high of 105.5 bcfd in December 2023. This reduction in output is linked to energy companies delaying well completions and reducing drilling activities earlier this year when prices were lower.
Meanwhile, US utilities added 98 billion cubic feet of gas to storage during the week ending May 31, surpassing market expectations and marking the ninth consecutive week of seasonal increases. Current stockpiles stand at 2,893 Bcf, which is significantly higher than both last year's levels and the five-year average.
The COMEX natural gas price has formed rounding formation on the daily scale and consolidating near to the breakout zone that indicates bullish move above $2.92 level. Moreover, on the daily chart, the Support levels are identified around $2.58 and $2.40, indicating potential areas where downward movement could stabilize. Conversely, resistance levels are noted at $3.15 and $3.38, signifying points where upward movement could face significant challenges.
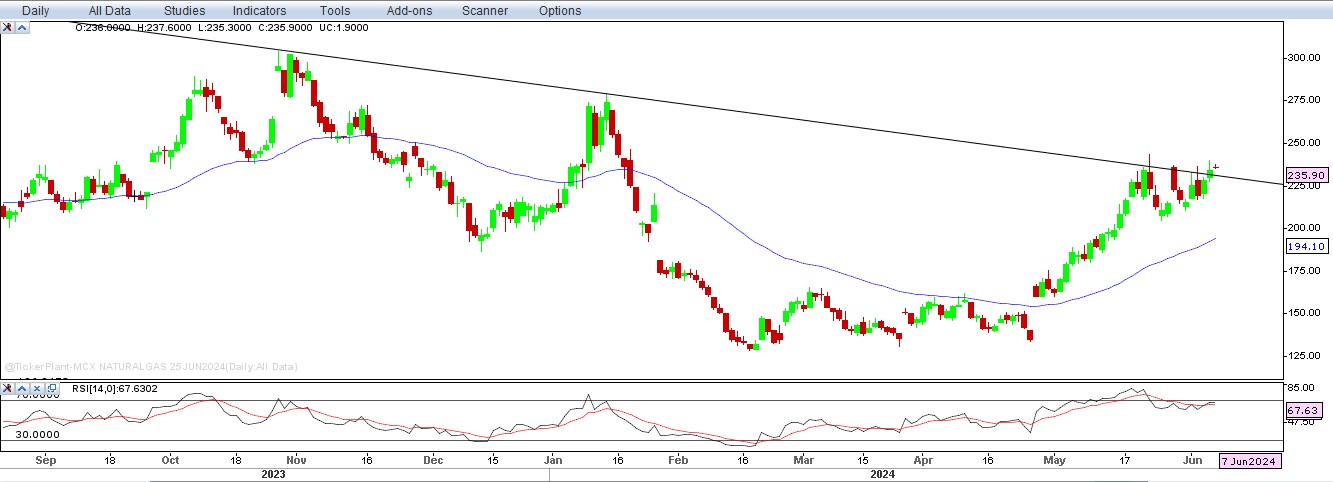
On the domestic front, MCX natural gas price trend moved above the Ichimoku Cloud and, indicating a bullish momentum for the short term. In additions, Prices are trading above the 200-days Exponential Moving Averages and falling trendline, the momentum reading suggests positive crossover with higher volume. Support is evident at Rs.215 and 205 levels, with resistance at Rs.278.
Important Key Levels:
|
MCX Natural Gas (Rs.) |
NYMEX Natural Gas ($) |
|
|
Support 1 |
215 |
2.58 |
|
Support 2 |
205 |
2.40 |
|
Resistance 1 |
267 |
3.15 |
|
Resistance 2 |
278 |
3.38 |
FREE Trading & Demat Account
Open FREE Demat Account with endless opportunities.
- Flat ₹20 Brokerage
- Next-gen Trading
- Advance Charting
- Actionable Ideas
Trending on 5paisa
Commodities Related Articles


by
Sachin Gupta
1st Jul 2024

Weekly Outlook on Gold - 24 May 2024
by
Sachin Gupta
27th May 2024

Weekly Outlook on Copper - 17 May 2024
by
Sachin Gupta
17th May 2024

How Long Gold Price Sustain to Shine in India!
by
Tanushree Jaiswal
8th May 2024
Disclaimer: Investment in securities market are subject to market risks, read all the related documents carefully before investing. For detailed disclaimer please Click here.